Basic Theory
基本理论
The idea behind vector search is: “What if we could represent the items in our database, as well as the input term, as vectors? We could then find the vectors which are closest to the input.” Let’s dig into that.
向量搜索背后的思想是:“如果我们能将数据库中的项目以及输入词都表示为向量,会怎么样?这样我们就可以找到与输入最接近的向量。“让我们深入探讨一下这个概念。
Vectors
向量
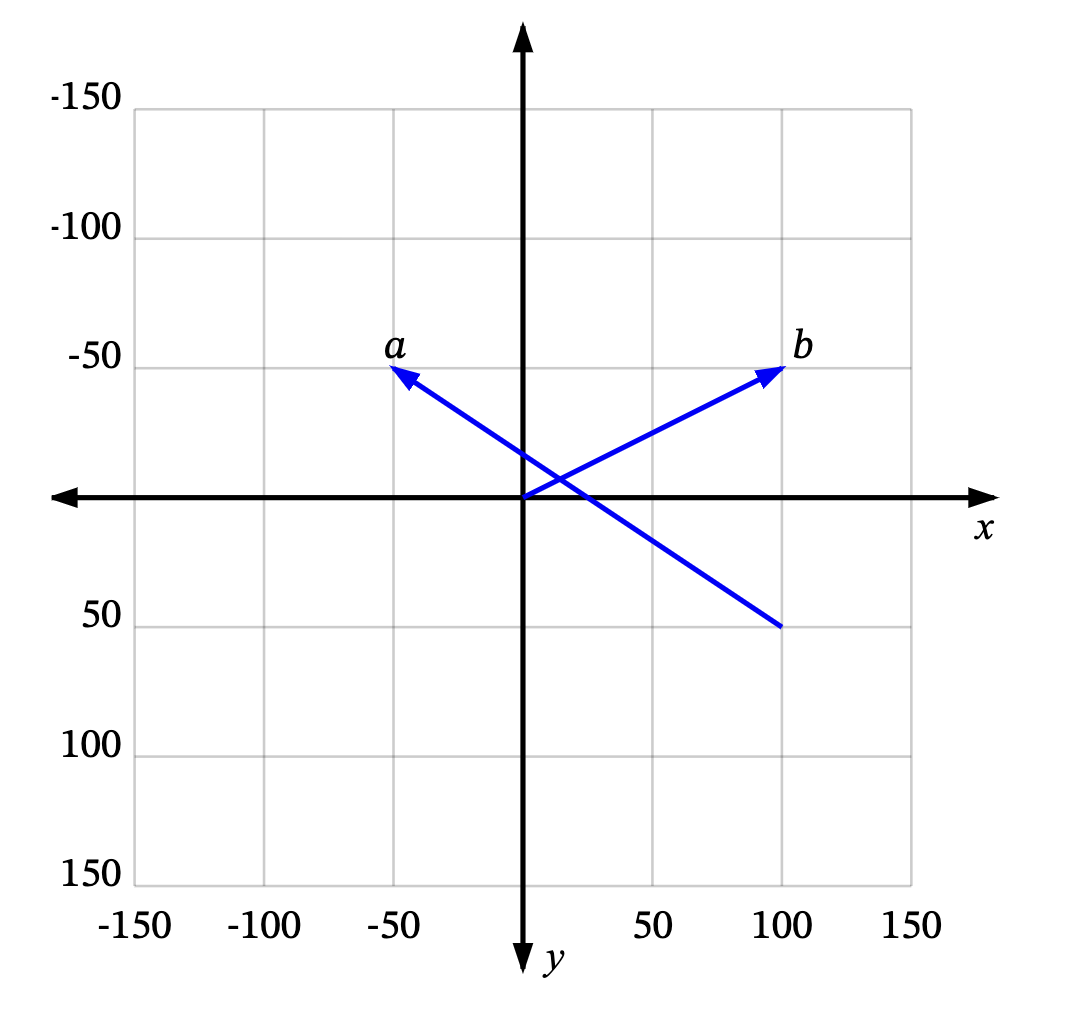
Think of a vector as describing a movement from one point in space to another point. For instance, in the graph below, we can see some vectors in 2D space: a is a vector from (100, 50) to (-50, -50), and b is a vector from (0, 0) to (100, -50).
可以将向量理解为描述从空间中一个点到另一个点的移动。例如,在下图中,我们可以看到二维空间中的一些向量:a 是从 (100, 50) 到 (-50, -50) 的向量,b 是从 (0, 0) 到 (100, -50) 的向量。
A lot of the time (and in the rest of this article), we deal with vectors starting from the origin (0, 0), such as b. We can then omit the “from” part, and simply say b is the vector (100, -50).
大多数时候(包括本文的其余部分),我们处理的是从原点 (0, 0) 开始的向量,比如 b。这样我们就可以省略”起点”部分,直接说 b 是向量 (100, -50)。
How do we extend the idea of vectors to non-numerical entities?
我们如何将向量的概念扩展到非数值实体?
Dimensions
纬度
As we’ve seen, each numerical vector has x and y coordinates (or x, y, z in a 3D system, and so on). x, y, z… are the axes, or dimensions of this vector space. Given some non-numerical entities we want to represent as vectors, we need to first decide on the dimensions, and assign a value to each entity for each dimension.
正如我们所见,每个数值向量都有 x 和 y 坐标(在三维系统中是 x、y、z,以此类推)。x、y、z…是这个向量空间的轴或维度。对于我们想要表示为向量的非数值实体,我们首先需要确定维度,然后为每个实体在每个维度上分配一个值。
For example, in a dataset of vehicles, we could define four dimensions: “number of wheels”, “moves on land”, “has an engine”, and “max occupants”. Then we could represent some vehicles as:
例如,在一个”车辆”数据集中,我们可以定义四个维度:“车轮数量”、“在陆地上移动”、“有引擎”和”最大乘员数”。然后我们可以将一些车辆表示为:
| item | number of wheels | has an engine | moves on land | max occupants |
|---|---|---|---|---|
| car | 4 | yes | yes | 5 |
| bicycle | 2 | no | yes | 1 |
| tricycle | 3 | no | yes | 1 |
| motorcycle | 2 | yes | yes | 2 |
| sailboat | 0 | no | no | 20 |
| ship | 0 | yes | no | 1000 |
So, our car vector would be (4, yes, yes, 5), or numerically, (4, 1, 1, 5) (putting yes = 1, no = 0).
因此,我们的汽车向量将是 (4, 是, 是, 5),或者用数字表示为 (4, 1, 1, 5)(将”是”设为 1,“否”设为 0)。
Dimensions are a way for us to (try to) capture the semantic meaning of an entity and represent it by numbers. For this reason, they are subjective. There’s no requirement to pick these specific dimensions. We could instead use, “has wings”, “uses diesel”, “top speed”, “average weight”, “price”, or whatever.
维度是我们(尝试)捕捉实体语义含义并用数字表示的一种方式。因此,它们是主观的。没有必要选择这些特定的维度。我们也可以使用”有翅膀”、“使用柴油”、“最高速度”、“平均重量”、“价格”等维度。
Dimensions are also called features or facets. They are an extremely important part of vector search (and data science/machine learning in general). We’ll see soon how the number and choice of dimensions can affect the search. For now, let’s continue with the next foundation of vector search.
维度也被称为”特征”或”方面”。它们是向量搜索(以及数据科学/机器学习)中极其重要的一部分。我们很快就会看到维度的数量和选择如何影响搜索。现在,让我们继续讨论向量搜索的下一个基础。
Similarity
相似度
Vector searches are also used in recommender systems. For example, recommending similar products, articles, shows, or songs to a customer based on something they already liked. In this case, the input is already part of the dataset.
向量搜索也用于推荐系统。例如,根据客户已经喜欢的内容向他们推荐类似的产品、文章、节目或歌曲。在这种情况下,输入已经是数据集的一部分。
So the question is how do we determine which are most similar?
那么问题是,我们如何确定哪些是最相似的?
We have to start by defining what we mean by similar. Every vector has a magnitude (aka length, or size) and direction. For instance, in this graph, p and a are pointing in the same direction, but are of different lengths. p and b are in exactly opposite directions, but have the same magnitude. And then there’s c, a bit shorter than p, and not pointing in the exact direction, but close.
我们必须首先定义我们所说的相似是什么意思。每个向量都有大小(也称为长度或尺寸)和方向。例如,在这个图中,p 和 a 指向相同的方向,但长度不同。p 和 b 方向完全相反,但大小相同。然后是 c,比 p 稍短,方向不完全相同,但很接近。

So which is most similar to p?
- If “similar” means pointing in a similar direction only, then a is the most similar to p. Next up is c. b is the least similar, since it points exactly opposite to p
- If “similar” means similar magnitude only, then b is the most similar to p (since it has the same length) followed by c, and then a.
那么哪个与 p 最相似?
- 如果”相似”仅意味着指向相似的方向,那么 a 与 p 最相似。其次是 c。b 最不相似,因为它指向与 p 完全相反的方向。
- 如果”相似”仅意味着大小相似,那么 b 与 p 最相似(因为它们长度相同),其次是 c,然后是 a。
In vector search, we rarely look at size alone. This is because you can easily get a vector with totally different values in each dimension but the same overall length (for instance, b is the same length as p, but points exactly opposite). Since vectors are often used to describe semantic meaning, looking at length alone will rarely give you what you want. Most measures of similarity either depend only on the direction, or both the direction and size.
在向量搜索中,我们很少只看大小。这是因为你可以轻易得到一个在每个维度上值完全不同但总长度相同的向量(例如,b 的长度与 p 相同,但方向完全相反)。由于向量通常用于描述语义含义,仅看长度很少能给你想要的结果。大多数相似度度量要么只依赖于方向,要么同时依赖于方向和大小。
Measures of similarity
相似度度量
Here are four ways vector similarity is often calculated:
- Euclidean distance: The direct distance between the “tips” of the two vectors. The Euclidean distance is 0 when the two vectors are the same, and increases as the angle (direction) or magnitude (length) of either increases. So, for a vector, p, we can compute the distances to all other vectors and pick the one with the smallest.
- Manhattan distance: This is also the distance between the “tips”, but assuming you were only allowed to walk parallel to the axes (left, right, up, down).
- Dot product : You get this by multiplying the corresponding dimensions from the vectors, and adding them up (ie ). This is a useful formula since it uses the dimensions of the two vectors, which means it accounts for both direction and magnitude.
- Cosine similarity : This works by finding the cosine of the angle between the two vectors (which means cosine similarity doesn’t consider magnitude, just direction). We get this by dividing the dot product by the product of the two lengths, ie .
以下是常用的四种计算向量相似度的方法:
- 欧几里得距离:两个向量”尖端”之间的直接距离。当两个向量相同时,欧几里得距离为 0,随着任一向量的角度(方向)或大小(长度)增加而增加。因此,对于向量 p,我们可以计算它到所有其他向量的距离,并选择最小的那个。
- 曼哈顿距离:这也是”尖端”之间的距离,但假设你只能平行于坐标轴移动(左、右、上、下)。
- 点积:通过将向量对应维度相乘并求和得到(即 )。这是一个有用的公式,因为它使用了两个向量的维度,这意味着它同时考虑了方向和大小。
- 余弦相似度:通过计算两个向量之间角度的余弦值得到(这意味着余弦相似度不考虑大小,只考虑方向)。我们通过将点积除以两个长度的乘积来得到,即 。
This graph shows the four measures for p to another vector a. Drag the tips of the vectors to reposition them, and watch how the values change. (Some things to try: putting the vectors at right angles to each other, putting them directly opposite each other, giving them the same magnitudes).
这个图展示了 p 到另一个向量 a 的四种度量。拖动向量的尖端来重新定位它们,观察值如何变化。(可以尝试:将向量互相垂直、将它们直接相对、给它们相同的大小)。

From this, we can see some useful facts about these measures, and how to choose:
从这里,我们可以看到关于这些度量的一些有用事实,以及如何选择:
The Euclidean distance is 0 if the vectors are exactly the same. As the size of one vector or the angle between them changes, it increases indefinitely. This is probably the most straightforward measure (smaller = more similar), and it’s quite commonly used. The Manhattan distance behaves similarly (0 when equal, then increases).
如果向量完全相同,欧几里得距离为 0。随着一个向量的大小或它们之间的角度变化,它无限增加。这可能是最直观的度量(越小 = 越相似),也是最常用的。曼哈顿距离的行为类似(相等时为 0,然后增加)。
The dot product starts at some number (not 0) when the two vectors are equal. If you keep the sizes of the two equal, and increase the angle , the dot product decreases, reaching 0 when the two vectors are at right angles. Keep on increasing the angle, and it decreases until they are directly opposite each other, then increases again until you get back to the start. On the other hand, if you increase the size of a while keeping the angle constant, the dot product just keeps increasing.
当两个向量相等时,点积从某个数(不是 0)开始。如果保持两个向量的大小相等,并增加角度,点积会减小,当两个向量垂直时达到 0。继续增加角度,它会减小直到它们完全相反,然后再次增加直到回到起点。另一方面,如果在保持角度不变的情况下增加 a 的大小,点积会持续增加。
This non-uniform distribution makes the dot product trickier to use (there is no maximum value; a smaller dot product could mean less similar or more similar). It’s also non-unique; there are multiple different positions for a that will give you the same dot product as when a = p. The dot product typically only makes sense when we can normalize all vectors to have the same length (at which point, it becomes equal to the cosine similarity).
这种非均匀分布使得点积的使用更加棘手(没有最大值;较小的点积可能意味着更不相似或更相似)。它也是非唯一的;对于 a 有多个不同的位置会给你与 a = p 时相同的点积。点积通常只有在我们可以将所有向量归一化为相同长度时才有意义(此时,它等于余弦相似度)。
Cosine similarity simply looks at the angle between the two vectors (or more accurately, the cosine of the angle). This means that the result is always between 1 and -1, while the dot product can be any number. The cosine is 1 when the vectors are exactly the same; it decreases to 0 when they’re at right angles, and then -1 when they’re exactly opposite. Such a neat property. Its disadvantage is that it does not consider the magnitudes---the cosine will have the same value for all vectors pointing in a certain direction, regardless of their length. Hence cosine similarity is often only used when all vectors in the dataset are of the same length, or we don’t care about their lengths.
余弦相似度只看两个向量之间的角度(更准确地说,是角度的余弦)。这意味着结果总是在 1 和 -1 之间,而点积可以是任何数字。当向量完全相同时,余弦为 1;当它们垂直时,降到 0;当它们完全相反时,为 -1。这是一个非常整洁的特性。它的缺点是不考虑大小——对于所有指向某个方向的向量,无论它们的长度如何,余弦都将有相同的值。因此,余弦相似度通常只在数据集中所有向量长度相同,或者我们不关心它们的长度时使用。
A second disadvantage of the cosine is that it’s more computationally expensive. To find the dot product, you need to multiply the dimensions for each vector together and add them up. To find the cosine similarity, you have to divide the dot product by the product of the two vectors’ magnitudes. This doesn’t seem like a big deal, but in a large database, with thousands or millions of vectors, each having hundreds or thousands of dimensions, this takes valuable CPU time. This is why Elasticsearch recommends using the dot product with all vectors normalized to the same length.
余弦的第二个缺点是它在计算上更昂贵。要找到点积,你需要将每个向量的维度相乘并求和。要找到余弦相似度,你必须将点积除以两个向量大小的乘积。这看起来不是什么大问题,但在一个大型数据库中,有成千上万的向量,每个向量有数百或数千个维度,这会占用宝贵的 CPU 时间。这就是为什么 Elasticsearch 建议使用点积,并将所有向量归一化为相同长度。
So how do you choose which measure to use? In practice, it boils down to knowing your data, and experimenting to see what gives you the best results. I’m no data scientist, but here’s what I gleaned from the Internet:
- The Euclidean distance is a “safe” default to use when you don’t know much about your data.
- If all vectors have the same length (or can be normalized to do so), cosine similarity/dot product is probably a good choice.
- The Manhattan distance might be a better measure if the vectors have a high number of dimensions (research paper PDF, StackExchange).
那么,你如何选择使用哪种度量?实际上,这归结为了解你的数据,并通过实验来看什么能给你最好的结果。我不是数据科学家,但这是我从互联网上收集到的信息:
- 当你对你的数据不太了解时,欧几里得距离是一个”安全”的默认选择。
- 如果所有向量都有相同的长度(或可以归一化为相同长度),余弦相似度/点积可能是一个不错的选择。
- 如果向量有很高的维度,曼哈顿距离可能是一个更好的度量(研究论文 PDF,StackExchange)。
A basic example
一个基本的示例
Let’s plot our dataset of vehicles. Since my graph can only represent two dimensions, I’ll take two dimensions from the table---“number of wheels” and “has an engine”. Let’s plot our vectors. Note that “number of wheels” is a continuous dimension (values from 0 and up), while “has an engine” is yes or no (0/1). This gives us the following vectors:
- car: (4, yes)
- bicycle: (2, no)
- tricycle: (3, no)
- motorcycle: (2, yes)
- sailboat: (0, no)
- ship: (0, yes)
让我们绘制我们的车辆数据集。由于我的图表只能表示两个维度,我将从表格中选取两个维度——“车轮数量”和”有引擎”。让我们绘制我们的向量。注意,“车轮数量”是一个连续的维度(值从 0 开始往上),而”有引擎”是是或否(0/1)。这给我们以下向量:
- 汽车:(4, 是)
- 自行车:(2, 否)
- 三轮车:(3, 否)
- 摩托车:(2, 是)
- 帆船:(0, 否)
- 轮船:(0, 是)
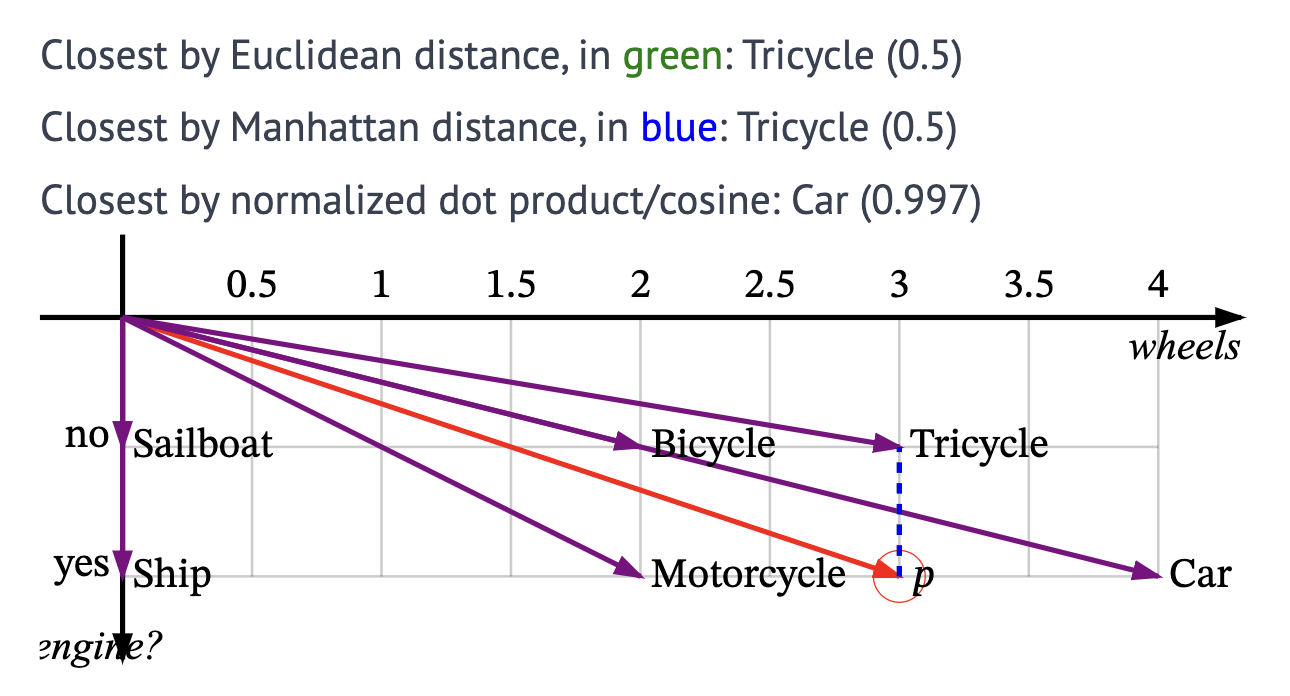
Also, imagine we’re searching for a vehicle which has three wheels and also has an engine. That is the vector (3, yes), represented by P on the graph below. You can see that there’s no such vehicle in our set, but the “most similar” within our current dimensions is the tricycle according to the Euclidean and Manhattan distances, but the car according to the cosine. You can try dragging the vector P around, and watch how the closest changes. Sometimes all three measures choose different vectors!
另外,假设我们正在搜索一种有三个轮子并且有引擎的车辆。这就是向量 (3, 是),在下图中由 P 表示。你可以看到我们的集合中没有这样的车辆,但在我们当前的维度中,根据欧几里得距离和曼哈顿距离,“最相似”的是三轮车,而根据余弦相似度,最相似的是汽车。你可以尝试拖动向量 P,观察最接近的向量如何变化。有时三种度量会选择不同的向量!
Voila, we have a very basic visual demo of vector search! Let’s write this as code.、
瞧,我们有了一个非常基本的向量搜索的可视化演示!让我们把它写成代码。
PS: You’ll notice that no/yes on this graph maps to 0.5/1, rather than 0/1. This is partly for visualization reasons (to make it easier to see on the graph), and partly for technical reasons (the cosine calculation tries to divide by the vector’s magnitude, which is impossible if the vector is 0). This is why you generally avoid having zero vectors in your dataset.
PS:你会注意到这个图中的否/是映射到 0.5/1,而不是 0/1。这部分是出于可视化的原因(使其在图上更容易看到),部分是出于技术原因(余弦计算试图除以向量的大小,如果向量是 0 则无法计算)。这就是为什么你通常应避免在数据集中有零向量。
Implementing
实现
Maths refresher: Here are the formulae we’re implementing to compute the similarity of two vectors and
- Euclidean distance (): Pair the corresponding dimensions of each vector together, find their difference, and square it. Then add everything together and take the square root. For 2D vectors, this is , but in general, .
- Manhattan distance (): Pair the corresponding dimensions of each vector together, find their difference, and take its absolute value (change negatives to positives). Then add everything together. For 2D vectors, this is , but in general, .
- Dot product (): Pair the corresponding dimensions of each vector together and multiply them, then add everything together. For 2D vectors, this is , but in general, .
- Cosine (): Find the magnitude of the two vectors, multiply them together, and divide the dot product by that. In maths notation, this is . For 2D vectors, the magnitude is .
数学复习:以下是我们用来计算两个向量 和 相似度的公式
- 欧几里得距离 ():将每个向量对应的维度配对,找出它们的差,并平方。然后将所有结果加在一起并开平方根。对于二维向量,这是 ,但一般来说,是 。
- 曼哈顿距离 ():将每个向量对应的维度配对,找出它们的差,并取绝对值(将负数变为正数)。然后将所有结果加在一起。对于二维向量,这是 ,但一般来说,是 。
- 点积 ():将每个向量对应的维度配对并相乘,然后将所有结果加在一起。对于二维向量,这是 ,但一般来说,是 。
- 余弦 ():找出两个向量的大小,将它们相乘,然后用点积除以这个结果。用数学符号表示,这是 。对于二维向量,大小是 。
Here’s a basic vector db in Ruby:
这里是一个基本的 Ruby 向量数据库:
class VectorDb
  attr_reader :vectors

  def initialize
 @vectors = {}
  end

  def add(**new_vectors)
 vectors.merge!(new_vectors)
  end

  def find_similar(vector, measure: :cosine, results: 3)
 vectors_with_distances =
   vectors.map do |other_vector_name, other_vector_dimensions|
  # The search vector may have some dimensions missing,
  # so we remove those from all vectors so that they don't factor into the search
  normalized_search_vector = search_vector.reject { |d| d.nil? }
  normalized_other_vector =
    other_vector_dimensions.reject.with_index { |b_i, i| search_vector[i].nil? }
  [other_vector_name, distance(normalized_search_vector, normalized_other_vector, measure)]
   end

 if measure == :cosine
   vectors_with_distances.max_by(results) { |name, distance| distance }.to_h
 else
   vectors_with_distances.min_by(results) { |name, distance| distance }.to_h
 end
  end

  private

  def distance(vector, other_vector, measure)
 __send__(measure, vector, other_vector)
  end

  def euclidean(vec_a, vec_b)
 Math.sqrt(
   vec_a.zip(vec_b).map { |(a_i, b_i)| (a_i - b_i) ** 2 }.sum
 )
  end

  def manhattan(vec_a, vec_b)
 vec_a.zip(vec_b).map { |(a_i, b_i)| (a_i - b_i).abs }.sum
  end

  def dot_product(vec_a, vec_b)
 vec_a.zip(vec_b).map { |(a_i, b_i)| a_i * b_i }.sum
  end

  def cosine(vec_a, vec_b)
 dot_product(vec_a, vec_b) / (magnitude(vec_a) * magnitude(vec_b))
  end

  def magnitude(vec)
 Math.sqrt(vec.map { |v_i| v_i ** 2 }.sum)
  end
end
Let’s test this vector database with the example of p and a above:
让我们用上面的 p 和 a 的例子来测试这个向量数据库:
db = VectorDb.new
db.add(a: [50, 125])

p = [100, 100]
p db.find_similar(p, measure: :euclidean)
p db.find_similar(p, measure: :manhattan)
p db.find_similar(p, measure: :cosine)
This gives:
输出:
{:a => 55.90169943749474}
{:a => distance=>75}
{:a => distance=>0.9191450300180579}
This implementation is super basic. The vectors are stored as a simple list, and we search through all the vectors to compute the scores for the chosen measure. This would be unbearably slow in a real-world application.
这个实现非常基础。向量被存储为一个简单的列表,我们搜索所有向量来计算所选度量的分数。在实际应用中,这将会非常慢。
Let’s bring our example dataset of vehicles to use with this vector database, still using the same two dimensions.
让我们把我们的车辆示例数据集带入这个向量数据库,仍然使用相同的两个维度。
db = VectorDb.new
# Dimensions used are:
# - number of wheels: (0, ...)
# - has engine: (0.5, 1)
vehicles = {
  car: [4, 1],
  bicycle: [2, 0.5],
  tricycle: [3, 0.5],
  motorcycle: [2, 1],
  sailboat: [0, 0.5],
  ship: [0, 1],
}
db.add(**vehicles)

p = [3, 1]
puts "Euclidean (smaller is better):"
puts db.find_similar(p, measure: :euclidean)
puts "Manhattan (smaller is better):"
puts db.find_similar(p, measure: :manhattan)
puts "Cosine (bigger is better):"
puts db.find_similar(p, measure: :cosine)
Euclidean (smaller is better):
{:tricycle=>0.5, :motorcycle=>1.0, :car=>1.0}
Manhattan (smaller is better):
{:tricycle=>0.5, :motorcycle=>1, :car=>1}
Cosine (bigger is better):
{:bicycle=>0.9970544855015815, :car=>0.9970544855015815, :motorcycle=>0.9899494936611664}
This matches our results from the graph.
这与我们从图表中得到的结果相匹配。
Choosing scales
选择尺度
In the earlier graph, I explained why we used 0.5/1 on our Boolean scale. But why not 1/2, 15/30, or some other scale? Well, we could, too. The graph would look slightly different, but how would our search results change? Let’s compute in code:
在之前的图表中,我解释了为什么我们在布尔尺度上使用 0.5/1。但为什么不用 1/2、15/30 或其他尺度呢?实际上,我们也可以这样做。图表会略有不同,但我们的搜索结果会如何变化呢?让我们用代码来计算:
puts 'With 1/2:'
db = VectorDb.new
db.add(
  car: [4, 2],
  bicycle: [2, 1],
  tricycle: [3, 1],
  motorcycle: [2, 2],
  sailboat: [0, 1],
  ship: [0, 2],
)

p = [3, 2]
# ...

puts 'With 15/30:'
db = VectorDb.new
db.add(
  car: [4, 30],
  bicycle: [2, 15],
  tricycle: [3, 15],
  motorcycle: [2, 30],
  sailboat: [0, 15],
  ship: [0, 30],
)

p = [3, 30]
# ...
-----
With 1/2:
Euclidean:
{:tricycle=>1.0, :car=>1.0, :motorcycle=>1.0}
Manhattan:
{:tricycle=>1, :car=>1, :motorcycle=>1}
Cosine:
{:bicycle=>0.9922778767136677, :car=>0.9922778767136677, :motorcycle=>0.98058067569092}
-----
With 15/30:
Euclidean:
{:car=>1.0, :motorcycle=>1.0, :ship=>3.0}
Manhattan:
{:car=>1, :motorcycle=>1, :ship=>3}
Cosine:
{:bicycle=>0.9994594068217016, :car=>0.9994594068217016, :motorcycle=>0.9994522288395831}
This is very interesting. Even though the two Boolean values remain in a constant ratio, the search results change (although not significantly).
这非常有趣。尽管两个布尔值保持恒定的比例,但搜索结果发生了变化(虽然变化不大)。
With an “unbalanced” scale such as 15/100:
- We’ll get the same distance results (Euclidean and Manhattan) for other “yes” vectors (100s), since our input is also a yes
- However, the distance from the “no” vectors will be affected. In our example, this doesn’t change much, but in a multi-dimensional search, it can have a bigger impact.
使用一个”不平衡”的尺度,比如 15/100:
- 对于其他”是”的向量(100),我们会得到相同的距离结果(欧几里得和曼哈顿),因为我们的输入也是”是”
- 然而,与”否”向量的距离会受到影响。在我们的例子中,这并没有改变太多,但在多维搜索中,它可能会产生更大的影响。
db.add(
  car: [4, 100],
  bicycle: [2, 15],
  tricycle: [3, 15],
  motorcycle: [2, 100],
  sailboat: [0, 15],
  ship: [0, 100],
)
p = [3, 100]
With 15/100:
Euclidean:
{:car=>1.0, :motorcycle=>1.0, :ship=>3.0}
Manhattan:
{:car=>1, :motorcycle=>1, :ship=>3}
Cosine:
{:car=>0.9999501235160887, :motorcycle=>0.9999500636867455, :sailboat=>0.9995503035223668}
This leads us to talk about the “weight” of a dimension. The reason the search results are affected is because all dimensions are being compared equally in the similarity calculations. For example, in the 15/30 example, there is a distance of 15 points between not having an engine and having one. This means that this is equivalent to a gap of 15 wheels. This makes the distance between yes and no larger than the distance between 2/3/4 wheels. So, given a search vector of “has engine” (= 30), our similarity scores will favour other vectors with an engine much more, even if they fall far of our other criteria.
这让我们谈到了维度的”权重”。搜索结果受到影响的原因是因为在相似度计算中,所有维度都被平等地比较。例如,在 15/30 的例子中,有引擎和没有引擎之间的距离是 15 个点。这意味着这相当于 15 个轮子的差距。这使得”是”和”否”之间的距离大于 2/3/4 个轮子之间的距离。因此,给定一个”有引擎”(= 30)的搜索向量,我们的相似度分数会更倾向于其他有引擎的向量,即使它们在其他标准上相差很远。
Conversely, the first version (0.5/1), has a distance of “0.5 wheels” between having an engine and not having one, so the engine part of the query has much less impact (as evidenced by the fact that tricycle ranks highest).
相反,第一个版本(0.5/1)在有引擎和没有引擎之间的距离是”0.5 个轮子”,所以查询中引擎部分的影响要小得多(这从三轮车排名最高的事实可以看出)。
This demonstrates the importance of choosing a good scale. This applies not only to Boolean dimensions: a dimension such as “number of occupants” which can vary from 1 to thousands will affect our search results drastically.
这展示了选择好的尺度的重要性。这不仅适用于布尔维度:像”乘员数量”这样可以从 1 变到数千的维度会极大地影响我们的搜索结果。
Multi-dimensional vectors and embeddings
多维向量和嵌入
Since we aren’t constrained to the 2D graph anymore, we can move further and add all our dimensions.
既然我们不再局限于二维图表,我们可以进一步添加所有的维度。
db = VectorDb.new

# Dimensions used are:
# - number of wheels: (0, ...)
# - has engine: (0.5, 1)
# - moves on land: (0.5, 1)
# - max occupants: (1, ...)
vehicles = {
  car: [4, 1, 1, 5],
  bicycle: [2, 0.5, 1, 1],
  tricycle: [3, 0.5, 1, 1],
  motorcycle: [2, 1, 1, 2],
  sailboat: [0, 0.5, 0.5, 20],
  ship: [0, 1, 0.5, 1000],
}
db.add(**vehicles)
Let’s search for a vehicle which moves on land and can carry 50 people. We don’t care about the number of wheels, but we want an engine,
让我们搜索一种在陆地上移动并能载 50 人的车辆。我们不关心轮子的数量,但我们想要有引擎,
p = [nil, 1, 1, 50]Our search algorithm in find_similar accounts for this nil value by removing any missing dimensions from both search and dataset vectors, so they don’t affect the results.
我们在 find_similar 中的搜索算法通过从搜索向量和数据集向量中移除任何缺失的维度来处理这个 nil 值,所以它们不会影响结果。
Euclidean:
{:sailboat=>30.008332176247315, :car=>45.0, :motorcycle=>48.0}
Manhattan:
{:sailboat=>31.0, :car=>45, :motorcycle=>48}
Cosine:
{:sailboat=>0.9999750508588203, :ship=>0.9996296030790003, :car=>0.9695607054902212}
All three measures rank sailboat highest, even though it has no engine and does not move on land. This is because of the weight of the “max occupants” dimension---its large values such as 20 and 1000 will dominate the simple 0.5/1 of the Booleans and 0-4 of the wheels. To make things more even, we can do two things:
- Change “moves on land” to spread out the values more (for instance, to 20 and 100 instead of 0.5 and 1)
- Change “occupants” to use buckets, rather than going from 0 to infinity. One such scale could be 1, 2, 3-6, 7-10, 10-15, 15-30, 30-60, 60-100.
所有三种度量都将帆船排在最高,尽管它没有引擎也不在陆地上移动。这是因为”最大乘员数”维度的权重——它的大值如 20 和 1000 会主导布尔值的简单 0.5/1 和轮子的 0-4。为了使事情更加均衡,我们可以做两件事:
- 改变”在陆地上移动”以更多地分散值(例如,使用 20 和 100 而不是 0.5 和 1)
- 改变”乘员”使用分桶,而不是从 0 到无穷大。一个这样的尺度可以是 1, 2, 3-6, 7-10, 10-15, 15-30, 30-60, 60-100。
There’s no “right” result. There are a lot of subjective tuning decisions, which means two data scientists can have the same dataset and same general algorithms, but differing results. Choosing the right dimensions, choosing which dimensions to drop to avoid overfitting results, choosing dimensions could at query time, choosing how to represent dimensions, etc.
没有”正确”的结果。有很多主观的调整决策,这意味着两个数据科学家可能有相同的数据集和相同的一般算法,但得到不同的结果。选择正确的维度,选择要_删除_哪些维度以避免过度拟合结果,在查询时选择维度,选择如何表示维度等。
In the real world, we deal with more data like this---sentences, paragraphs, topics, products, images, etc. As you can see, this process of determining dimensions (feature engineering) can be quite difficult and time-consuming. Not only do you need to be intensely familiar with the data (gigabytes? terabytes? petabytes?) in order to recognize what dimensions are important, you also need to experiment to find the most suitable dimensions.
在现实世界中,我们处理更多这样的数据——句子、段落、主题、产品、图像等。正如你所看到的,这个确定维度的过程(特征工程)可能相当困难和耗时。你不仅需要非常熟悉数据(千兆字节?太字节?拍字节?)以识别哪些维度重要,还需要进行实验以找到最合适的维度。
Additionally, there’s the task of converting the input to a vector (except in recommender systems), which requires automated semantic analysis.
此外,还有将输入转换为向量的任务(除了在推荐系统中),这需要自动语义分析。
There is an alternative. With vector embeddings, you can train a model (or use a pretrained model) which handles this, classifying the dataset to come up with several dimensions. For better results in specialised domains, you may still want to combine with some manual feature extraction.
还有一种替代方法。使用向量嵌入,你可以训练一个模型(或使用预训练模型)来处理这个问题,对数据集进行分类以得出几个维度。为了在专门领域获得更好的结果,你可能仍然想要结合一些手动特征提取。
Let’s play with embeddings a bit. We’ll use this library, @xenova/transformers. Transformers are one technique for generating embeddings of text. Using a library rather than an API means that all analysis and classification is done locally, so the library must come with its own inbuilt corpus of words. (This library’s size is 46 MB!)
让我们稍微玩一下嵌入。我们将使用这个库,@xenova/transformers。Transformers 是生成文本嵌入的一种技术。使用库而不是 API 意味着所有分析和分类都在本地完成,所以库必须带有自己内置的词汇库。(这个库的大小是 46 MB!)
I couldn’t find any libraries for Ruby, so this means porting the vector database to JavaScript:
我找不到任何 Ruby 的库,所以这意味着要将向量数据库移植到 JavaScript:
class VectorDb {
  vectors = {};

  add(newVectors) {
 Object.assign(this.vectors, newVectors)
  }

  findSimilar(searchVector, measure, results = 3) {
 let vectorsWithDistances =
   Object.entries(this.vectors).map(([otherVectorName, otherVectorDimensions], _) => {
   let normalizedSearchVector = searchVector.filter(d => d !== null);
   let normalizedOtherVector =
  otherVectorDimensions.filter((b_i, i) => searchVector[i] !== null)
   return [otherVectorName, this.distance(normalizedSearchVector, normalizedOtherVector, measure)]
 }).sort((v1, v2) => v1[1] - v2[1]);

 return Object.fromEntries(
   measure === 'cosine' ?
   vectorsWithDistances.reverse().slice(0, results)
   : vectorsWithDistances.slice(0, results)
 );
  }

  distance(vector, otherVector, measure) {
 return this[measure].call(this, vector, otherVector)
  }

  euclidean(vec_a, vec_b) {
 return Math.sqrt(
   this.sumForEach((a_i, b_i) => (a_i - b_i) ** 2, vec_a, vec_b)
 )
  }

  manhattan(vec_a, vec_b) {
 return this.sumForEach((a_i, b_i) => Math.abs(a_i - b_i), vec_a, vec_b)
  }

  dotProduct(vec_a, vec_b) {
 return this.sumForEach((a_i, b_i) => a_i * b_i, vec_a, vec_b)
  }

  cosine(vec_a, vec_b) {
 return this.dotProduct(vec_a, vec_b) / (this.magnitude(vec_a) * this.magnitude(vec_b))
  }

  magnitude(vec) {
 return Math.sqrt(this.sumForEach(v_i => v_i ** 2, vec))
  }

  sumForEach(fn, ...vectors) {
 return vectors[0].reduce((acc, v_i, i) => {
   return acc + fn(...vectors.map(v => v[i]));
 }, 0);
  }
}
Now, rather than manually create vectors, we only use the words, and the transformers library does this for us.
现在,我们不再手动创建向量,而只使用单词,transformers 库为我们完成这个工作。
import { pipeline } from '@xenova/transformers';
let extractor = await pipeline('feature-extraction');
let generateEmbedding = (word) => extractor(word, { pooling: "mean", normalize: true })

let vehicles = [
  'car',
  'bicycle',
  'tricycle',
  'motorcycle',
  'sailboat',
  'ship',
]

let vehicleEmbeddings = await Promise.all(vehicles.map(name => generateEmbedding(name)))
let vehiclesMap = Object.fromEntries(vehicles.map((name, i) => [name, vehicleEmbeddings[i]]))
This takes a few seconds to run on my machine the first time (not much, but noticeable), which shows that running ML models, even ones as small as this involve a lot of CPU time.
这在我的机器上第一次运行需要几秒钟(不多,但可以注意到),这表明运行机器学习模型,即使是像这样小的模型也需要大量的 CPU 时间。
If you’re curious to see what the generated embeddings look like, here’s what the embedding for car is:
如果你好奇生成的嵌入是什么样子,这里是 car 的嵌入:
Tensor {
  dims: [ 1, 384 ],
  type: 'float32',
  data: Float32Array(384) [
 -0.031706273555755615,     0.1090739443898201,   0.012603563256561756,
   0.05875611677765846,   -0.03913160786032677,   0.032443128526210785,
 ... 378 more items
  ],
  size: 384
}
This thing is huge! I’m not familiar with the details, but it appears that “car” has been turned into a 384-dimension vector.
这东西太大了!我不熟悉细节,但看起来”car”已经被转换成了一个 384 维的向量。
Let’s see how the search does. We can’t put in a random vector as before, since the embeddings are now controlled by the transformer, but let’s see what happens when we search for a vehicle not in our dataset.
让我们看看搜索的效果如何。我们不能像以前那样输入一个随机向量,因为嵌入现在由 transformer 控制,但让我们看看当我们搜索一个不在我们数据集中的车辆时会发生什么。
async function search(word) {
  let p = await generateEmbedding(word)
  console.log("Euclidean:")
  console.log(db.findSimilar(p, 'euclidean'))
  console.log("Manhattan:")
  console.log(db.findSimilar(p, 'manhattan'))
  console.log("Cosine:")
  console.log(db.findSimilar(p, 'cosine'))
}
search('e-bike')
Euclidean:
{
bicycle: 0.8344609209916007,
motorcycle: 0.8977509140426253,
tricycle: 0.9996304153817714
}
Manhattan:
{
bicycle: 13.002568852846004,
motorcycle: 13.984138461616215,
tricycle: 15.961311867872588
}
Cosine:
{
bicycle: 0.6518374948251899,
motorcycle: 0.597021662747392,
tricycle: 0.5003696104110993
}
These are pretty good results. An e-bike is indeed most similar to a bicycle (it is a kind of bicycle), and then a motorbike, and a distant cousin, the tricycle. All three measures return similar rankings.
这些结果相当不错。电动自行车确实最接近自行车(它是一种自行车),然后是摩托车,再远一点是三轮车。三种度量返回了相似的排名。
Searching for “truck”:
搜索”卡车”:
Euclidean:
{
  car: 0.8310878560616409,
  motorcycle: 0.9929289945588754,
  bicycle: 1.005725251152928
}
Manhattan:
{
  car: 12.967854919763596,
  motorcycle: 15.50279750485964,
  bicycle: 15.86006192120071
}
Cosine:
{
  car: 0.6546464440552332,
  motorcycle: 0.5070459014501628,
  bicycle: 0.4942582474585483
}
And searching for “speedboat”:
搜索”快艇”:
Euclidean:
{
  sailboat: 0.688214933677928,
  ship: 0.9114324817410895,
  car: 1.0909516960778003
}
Manhattan:
{
  sailboat: 10.658648524569825,
  ship: 14.01096388567844,
  car: 16.868695075216202
}
Cosine:
{
  sailboat: 0.7631800985510027,
  ship: 0.5846454070601506,
  car: 0.40491218686683284
}
Nice!